Baby Blues: Neonatal, Infant, and Toddler Research Challenges

The first five years of a child’s life are marked by considerable change—both physiological and psychological. Young children undergo incremental development in their ability to think and solve problems, their emotions, and their linguistic abilities, to name just a few developmental changes. Over time, the rapidity and extent of this development vary by individual, even among children of the same age. For these reasons, research techniques and tools must be adopted that are suitable for the participant’s age group. In this constantly evolving segment of the physiological and psychophysiological field, new approaches and technologies are being implemented with the needs of our youngest participants in mind.

Different Needs, New Approaches

A recent article published by researchers at the University of California Irvine outlined some of the challenges in conducting research within the neonatal to toddler age groups. Chief among these was the higher levels of attrition among these groups compared to older test subjects. Much of this can be linked to the general characteristics of the test group—reduced ability to sit still for long periods of time, shorter attention span, and lack of motivation to participate. While these factors may not surprise an experienced parent or childcare provider, they can throw a wrench into any study that has not taken such challenges into account.

Tools for Toddlers

Choosing the right tools and applying them appropriately in the lab setting can not only significantly improve attrition rates, but also the quality of data. Receiving a clear, uninterrupted signal when gathering data from a research participant is challenging under the best of conditions and can seem insurmountable when it involves a potentially fussy, fidgety young child or infant. Thankfully, research tools and technologies have been developed with our youngest participants in mind. These include electrodes for infants that are not only sized appropriately but also designed not to irritate sensitive skin, as well as infant-sized EEG caps that are comfortable enough to be worn for extended periods and secure to prevent excess movement and signal loss.

Combining Technique with Technology

Dyadic ResearchSome researchers have found the best approach to tackling the challenges presented by these youngest participants is a combination of age-appropriate strategies and specialized equipment. A 2020 dyadic study published in the Journal of Cognitive Neuroscience examined the Effects of Maternal Singing Style on Mother-Infant Arousal and Behavior by using skin conductance (SC) levels as a measure of arousal in both the mother and infant participants. Both participants were fitted with pre-gelled electrodes attached to BioNomadix wireless EDA transmitters, which are less cumbersome than a fully wired solution. While the mother’s electrodes were attached at the neck, the infants were attached to the foot and secured in place with paper medical tape and covered with a sock. This ensured the electrodes would be held securely in place and reduce movement that could negatively impact signal quality.

We have only scratched the surface of the tools and strategies available for conducting lab research on very young participants. For additional information, watch our webinar on Research and Best Practices for Recording from Newborns, Infants, and Toddlers.


For additional information on research tools for young participants, contact your local BIOPAC sales representative.
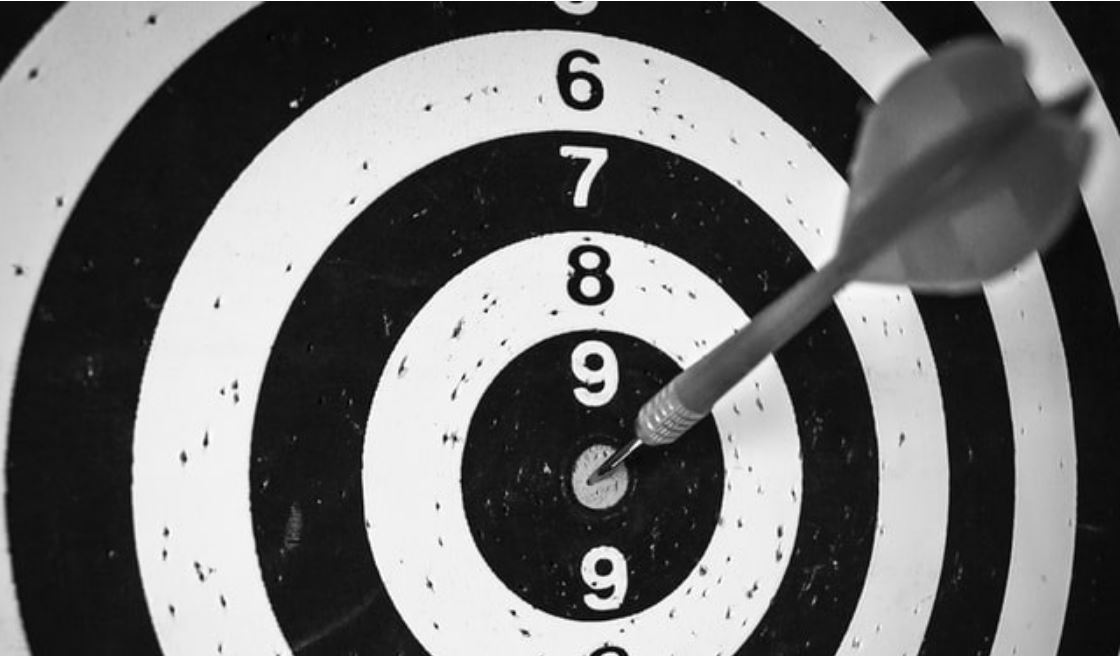
Hitting the Mark: Using Event Markers to Improve Data Quality

Life is a series of events—some are planned while others catch us completely by surprise. This holds true in the lab where the quality of experiments and data depend on accurately identifying, tracking, and sorting key events as they occur. Events like the introduction of stimuli and a test subject’s reaction directly impact data.

Life is a series of events—some are planned while others catch us completely by surprise. This holds true in the lab where the quality of experiments and data depend on accurately identifying, tracking, and sorting key events as they occur. Events like the introduction of stimuli and a test participant reaction directly impact data. Similarly, unplanned events, such as when a participant coughs or sneezes during a respiratory experiment, can affect overall data quality.

In this context, we define an “event” as piece of information associated with a specific time in a waveform. An event can capture points of interest within a file (e.g., subject moved, dose added) or on a particular channel (e.g., T-wave onset).

Whether intentional or not, critical events need to be easily located and identified by those running an experiment. Event marking provides the key to this by helping researchers eliminate outlier data while making it possible to locate data that is significant to the experiment. Today’s researchers benefit from data acquisition software that offers some form of event marking functionality to easily identify, label, and categorize such events. BIOPAC’s latest build of AcqKnowledge, for example, integrates extremely easy-to-use event marking tools that enable users to mark “quick events” with a simple tap of a function/hotkey for 17 different event categories, each containing multiple types of events.

“I’m struggling to think of any time you wouldn’t be using these,” said BIOPAC Technical Support Manager David Pollock as part of the recent webinar AcqKnowledge Bootcamp: Set Up Experiments to Facilitate Data Analysis. “They are critical to being able to interpret your data after you acquire it.”

The benefits of event markers include:

  • Allowing researchers to differentiate stages of an experiment
  • Making it easy to eliminate outlier data
  • Allowing researchers to track and identify stimuli
  • Providing control over event tracking, thus eliminating errors
A Tale of Two Studies

A pair of recent studies illustrate how data acquisition software like AcqKnowledge can streamline event marking. The first sought to test the viability of various commercial-off-the-shelf ECG sensors for monitoring stress levels in participants. Test participants used a manual button to self-mark stress events triggered by mental arithmetic tasks, startle response tests, and a cold-water response test. A BIOPAC MP Research System data acquisition unit provided a clinical baseline for comparison with the pair of COTS ECG monitors. The limitations of self-reported events were revealed when participants were found to have accidentally activated the stress “clicker” about 60% of the time.

Physiological Data in Military StudyA similar 2018 John Hopkins University study avoided this problem through both automated and researcher-controlled event marking. When examining how military commanders maintain combat effectiveness while responding to a range of potentially stressful battlefield situations, researchers employed AcqKnowledge to record event marks at the onset and offset of various stimuli. Physiological data was fed to an AcqKnowledge-equipped computer via a BIOPAC DAQ connected to an STP100C digital interface module. Event markers generated by both AcqKnowledge and E-Prime allowed researchers to easily identify stimuli as well as each task the participants performed by name, start time, end time, and duration.

Not leveraging the power of event marking tools can result in key experimental events being lost in a flood of data, potentially corrupting results. Check out this video tutorial to learn more about event marking with AcqKnowledge.

Enhance Consistency with an Automated Lab Refresh

The global COVID-19 pandemic made in-person lab work impossible under many circumstances and difficult in the best of conditions. Now, as researchers and students begin to return to the lab, an opportunity presents itself for a fresh start. One way in which labs are refreshing their approach to research and education is by adding software and equipment that allows for the automation of procedures and analysis with the goal of increasing repeatability and reproducibility within experiments and research.

It’s been a challenging 18 months for science educators and those running research facilities. The global COVID-19 pandemic made in-person lab work impossible under many circumstances and difficult in the best of conditions. Now, as researchers and students begin to return to the lab, an opportunity presents itself for a fresh start. One way in which labs are refreshing their approach to research and education is by adding software and equipment that allows for the automation of procedures and analysis with the goal of increasing repeatability and reproducibility within experiments and research.

Crisis of reproducibility

The phrases “reproducibility crisis” and “replication crisis” became buzzwords in the scientific community in the 2010s, with that notoriety spilling over into both the scientific and mainstream media’s coverage of the sciences. Several high-profile scientific and sociological studies were called into question when researchers were unable to reproduce their results. In 2015, a group of psychology researchers under the moniker of the “Open Science Collaboration” found that they were only able to reproduce the findings of 68% of studies published in high-ranking peer-reviewed journals. A 2016 survey of 1,576 researchers by the journal Nature similarly found that 52% agreed that there was a “crisis” of reproducibility, though most said they still trusted published research.

The automated advantage

One step that researchers can take to ensure the reproducibility of their experiments and thereby boost the integrity of their data and conclusions is by automating procedures, workflow, and record keeping. These steps not only reduce the possibility for human error, but also provide a clear roadmap for future researchers to repeat processes in the lab to review and test results. The National Academies of Sciences, Engineering, and Medicine guide Reproducibility and Replicability in Science (National Academies Press, 2019) outlines several of the ways in which automation is being used to enhance reproducibility of research results, including record keeping, data analysis, data version control, and workflow management. The publication notes that “automated scientific workflows are essential in data-intensive and large-scale science missions that aim to be computationally reproducible.”

A 2019 study by researchers at the Indiana University School of Informatics, Computing, and Automated studyEngineering employed these techniques to demonstrate “how automation can be used to address many of these factors contributing to the replication crisis.” The study focused on the controlled rearing of chicks, comparing automated and non-automated research methods. The study found that the automated tracking system allowed researchers to increase the amount of data collected from each test subject, which in turn “reduced measurement error by 60% and increased the effective size of experiments by about 300%.”

An automated refresh

BIOPAC’s AcqKnowledge data acquisition and analysis software allows labs of any size to gain the advantage of automation to improve both the efficiency and effectiveness of research. Features like Batch Processing and  BIOPAC Basic Scripting help eliminate the potential for human error by consolidating multiple tasks into a single automated routine. A heightened level of standardization and consistency results in improved data quality. Adding a Basic Scripting license to AcqKnowledge 5.0.6 ensures results are reproducible regardless of who is carrying out the experiment.

The Right Tools: Streamlining Stimulus Presentation

Our nervous system processes information from a dizzying array of stimuli—visual, auditory, thermal, olfactory, and tactile, among others. How organisms respond to stimuli provides researchers with a wealth of information on how they adapt, learn, and live. The complex interaction between stimulus and response presents a myriad of challenges when it comes to creating effective stimuli in the research environment and accurately gathering data from subjects.

Today’s researchers have been gifted with a variety of stimulus presentation options to suit their individual needs. Complex experiments may call for robust solutions that integrate a wide range of stimulus presentation and data acquisition hardware and software, often from various industry leading manufacturers such as BIOPAC, E-Prime, and Cedrus. Such experiments can combine multiple stimuli with advanced stimulus controls and data gathering techniques.

Stimulus presentation, however, is not a one-size-fits-all proposition and some researchers may prefer a simpler solution that integrates visual stimulation presentation tools with powerful eye-tracking, as is available with BIOPAC’s screen-based Eye Tracking system. Additionally, AcqKnowledge now offers native integration and synchronization of stimulus presentation, eye tracking, and physiology data acquisition and analysis, all easily managed from a single application.

The seamless integration of stimulus presentation in data gathering and analysis allowed a team of researchers from the University of Connecticut and Emory University to monitor electrodermal activity (EDA) in subjects as they responded to pain stimuli induced by electrothermal grills. The goal of the study was to determine the viability of using such grills to induce pain without causing physical harm to research subjects. Researchers recorded and stored EDA signals from electrodes attached to the subjects’ fingers with a BioNomadix® wireless amplifier and MP160 data acquisition device connected to a computer running AcqKnowledge. A STMISOC programmable stimulus isolation adapter provided EP stimulation, allowing software-controlled adjustment of stimulus pulse width, repetition, and setup of an arbitrary pulse stimulus sequence via AcqKnowledge.

Using a single integrated system doesn’t necessarily equate sacrificing utility, nor does cross-platform integration need to be complicated. A group of researchers in Beijing recently explored the connection between fear response, conditioning, and memory that required the application of electrical shocks of varying intensity. A constant current STM200 stimulator delivered the shocks, in this case controlled by E-Prime software while data was collected by an MP150 running AcqKnowledge. In its current build, AcqKnowledge also integrates stimulus presentation and data acquisition, potentially streamlining the design of such an experiment.

Scent deliveryStudies requiring the simultaneous introduction of multiple stimuli can raise the level of complexity for researchers, as it did in a recent study that examined a link between pleasant touch and scent with facial muscle activity and heart rate. Facial EMG and ECG data were collected using a BIOPAC MP Research System with a BioNomadix® wireless system connected to a computer running AcqKnowledge; current builds of the software provide full integration of scent delivery hardware.

BIOPAC’s new integrated stimulus presentation meshes seamlessly with Eye Tracking and data acquisition, providing researchers with an integrated solution to save valuable time and effort.


BIOPAC Systems, Inc. provides life science researchers and educators with data acquisition and analysis systems that inspire people and enable greater discovery about life.

Scaling Up: The Challenges of Large-Group Studies

When formulating an approach to a research study, planning experiments, and choosing the right technology for the job, size matters. Research studies with human subjects generally fall into three scale-related categories: individual, small-group, and large-group studies. When we discuss “size” in this context, we are talking about the number of subjects sampled together at one time and in one location.

Single-participant studies sample data from subjects separately while dyadic research gathers input from two subjects at the same time and place. It may be necessary, however, to take readings from three, four, or dozens of study subject simultaneously. In such cases, researchers often want to measure how the participants react to identical stimuli or the same external conditions such as those found in a classroom, courtroom, or theater setting. Researchers may also seek to measure how subjects react or interact with other members of the study group such as during business exchanges, in a meeting room environment, or in game sessions or other competitive settings.

These large-group studies present critical challenges that may not normally occur in single-participant studies. First, the stimuli to which the participants respond must be presented in a uniform and synchronous manner. Whether the stimuli are visual or auditory, thermal or olfactory, electrical or haptic, all study subjects must be able to respond to the same stimulus.

A recent study in behavioral economics measured psychophysiological reactions to various stimuli in the form of market and trading games in which multiple interactions took place between a set of “players.” Timing was critical to accurately measure the participants’ physiological responses to trades, losses, and gains. Both the presentation of stimuli and the recording of the participants’ reactions had to be precisely synchronized.

Methods for recording subjects’ response may include biopotential data such as ECG/EKG, EEG, EMG; transducer signals that can include electrodermal activity (EDA), respiration, and temperature; eye tracking; video recording; subjective response; or fNIRS, to name just a few examples. In the above study, participants were equipped with a photodiode that recorded responses during a decision-making experiment. Signals from the photodiodes were transmitted to a 16-channel BIOPAC MP150 Data Acquisition System (since replaced by the MP160 Data Acquisition System), allowing the simultaneous, synchronous recording of timing data from up to 16 subjects.

Child StudiesSynchronizing data is just one consideration when conducting multi-participant studies. Other logistical challenges arise when participants must interact with their surroundings. Another large-group study compared physical and psychological activity among seven-year-old elementary school children as they learned geometry through movement-based teaching methods. This presented several challenges, including the age of the subjects and the need for freedom of movement. Such problems are common to large-group studies that require multiple participants to move unimpeded by recording apparatuses. Typically, a researcher will choose between either a minimally invasive tethered device that can be wired to a data acquisition unit (e.g., BIOPAC ECG100D Smart Amplifier) or a wireless device (e.g., BIOPAC BN-ECG2 Wireless ECG Amplifier) that permits additional freedom of movement. In this study, the researchers used wearable devices to record the children’s energy expenditure, intensity of movements, EDA, body heat flux, and skin temperature.

While large-group studies present an array of unique challenges to gathering data, these challenges can be overcome through careful planning and by choosing the right tools for the job. BIOPAC offers a wide range of scalable technologies, software, and accessories for conducting research with individual subjects, pairs, or large groups that can be adapted to an array of scenarios and research settings.

THE BIG 3: Crucial Signals for Interdisciplinary Psychophysiology Research

This guest post was written by Michael Hogan, BIOPAC’s Southeast Regional Representative. Contact him at michaelh@biopac.com

Even trained psychologists can be daunted by the interdisciplinary applications involved with recording objective physiological data. However, it is not necessary to learn the intricacies of bio-medical engineering, physics, statistics and underlying physiological mechanisms of the body just to incorporate these objective measures into your research. With just a few key signals of interest, and a simple hardware and software setup, a trained researcher can record and interpret the objective physiological responses of participants in a physiology study.

How to get started? Begin with a protocol you are already studying and incorporate “THE BIG 3”

  1. ECG: Electrocardiography is a biopotential, meaning direct measurement of the electrical voltage potential changes of the heart as it completes its “cardiac cycle.” Since we can record these voltage changes and graphically repECG Signals in AcqKnowledgeresent them as a waveform through analog to digital conversion, we are able to identify changes in the behavior of the heart in response to the presented stimulus. We can then establish a recurring reference point in the “R-Peak” of the QRS complex, we are able to measure the distance between these R-Peaks and establish an R-to-R interval, this measure tells us the time in-between cycles or “beats” of the heart. From one beat to the next, we can establish the participant’s heart rate. Once we have established a heart rate, we are able to extract valuable measures, such as Heart Rate Variability: how the heart rate changes over an observed set of time intervals or in response to the correlated stimulus.
  1. Respiration: The respiration cycle is what is known as a transduced physiological signal. This means we utilize a mechanical apparatus to create a voltage potential in response to the inhalation and exhalation phases of the respiratory cycle. These voltage changes can then be measured and graphically represented as a waveform for further analysis. The respiratory cycle waveform can tell us the following:
    • Respiratory rate: the number of cycles that occur within a given time interval or changes in response to a stimulus.
    • Amplitude: What is the change in magnitude of the cycle, shallow vs. deep breathing.
    • Respiratory Sinus Arrythmia (RSA): When collected along with an ECG signal, this analysis accounts for the changes in the participant’s heart rate as a response to the inhalation and exhalation phases of the respiratory cycle. For example, the heart rate elevates when the participant inhales and decreases when the participant exhales.
  1. EDA: Electrodermal Activity has been adopted as the newest nomenclature for Galvanic Skin Response “GSR.” To this day EDA is touted as the best measure of sympathetic nervous system “activation.” As a derivative physiological measure, we pass a small, imperceptible current (0.5 V) into the participant’s body and measure the change from this known value as the participant responds.

As the autonomic nervous system responds to stimuli, it stimulates the eccrine glands to produce sweat. The sweat produced lowers the impedance to the current passing into the participant. We can then measure the change and extract meaningful data regarding how the participant responded to the chosen stimulus.

  • Skin Conductance Response (SCR): The magnitude of the response that occurred as a result of the stimulus from its onset to its peak.
  • Skin Conductance Level (SCL): How long it took for the response to occur following the chosen stimulus from its onset to its peak.
  • Recovery time: How long it takes the response to diminish and return to “baseline/normal” values.

With these “BIG 3” physiological measures we can perform hundreds of research protocols and objectively correlate patterns of behavior. Once these measures have been employed, we can integrate other measures for more comprehensive studies, such as:

  • EEG and fNIR for cognitive processing and learning metrics
  • Non Invasive Blood Pressure (NIBP) for stress and cardiovascular metrics
  • Facial EMG, fEMG, or Facial Coding Software for affective emotional states metrics

Visit us at www.biopac.com or click the following links for information on:

Signal-Specific Webinars
Detailed Application Notes
Signal Specific Analysis Video Tutorials
Physiological Recording Knowledge Base
Signal guides for ECG and EDA


BIOPAC Systems, Inc. provides life science researchers and educators with data acquisition and analysis systems that inspire people and enable greater discovery about life.

A Brief Tour of Psychophysiology

Why are we interested in psychophysiological measurements? Which measurements are these exactly? By “measurements,” we are talking about micro-facial expressions, pupil dilation, peristaltic contractions of the intestines, heart activity, breathing patterns, electrodermal activity, and other responses not visibly apparent.

In the 1880s, an English philosopher named William James was among the first to explore what constitutes an “emotion.” James believed that everything, big and small, that happens to us and around us elicits a constant stream of feelings and responses. These responses can range from indifference, fear, excitement, happiness, stress—virtually the full gamut of the human emotional palette.

Why does this happen and how do we measure it?

There is always a response in our bodies as a consequence of input delivered via our senses, and there is a resulting “feeling” that happens. Sometimes the feeling doesn’t have much impact but at other times, its effect is profound. The term “emotion” is the label that we assign to these feelings. These feelings result in a response that affects our physiology. These physiological responses to ongoing events are objectively measurable and referred to as “affect.”

Data enters the brain via our senses, but it takes a small period of time to process the input; about 50 milliseconds if the event is a sound, and 100 milliseconds if visual. When data comes in, it travels through various neural pathways and our response to it is informed by our previous experiences. An extreme example to external input causing profound affective changes would be in someone with post-traumatic stress disorder (PTSD), in which certain sounds, or other situational input can trigger pronounced panic or discomfort. People with phobias (for example, fear of cats) will exhibit physiological changes far out of proportion to the actual danger posed by the perceived input. Someone who loves cats would undoubtedly experience a warm fuzzy feeling, whereas a person with a cat phobia would be panicked, resulting in dramatic and measurable changes in heart rate, respiration, and eccrine activity (skin sweating).

An evolutionary motivation baked in to our consciousness is the “fight or flight” response, in which we respond to danger and make a quick decision whether to run or defend ourselves. We all have different thresholds for which input might trigger this response. The line is often blurred between what constitutes actual danger or a seemingly innocuous sensory event that ignites an unpleasant memory or triggers the ghost of a previous traumatic experience.

Now that we have briefly explored a thumbnail sketch of psychophysiology, what kind of equipment is used for recording psychophysiological data? When we set up a psychophysiology experiment, we can record the changes occurring in the body and analyze the results with a great depth of accuracy. To record these signals, specific data acquisition hardware such as the BIOPAC MP36 is commonly used, with a SS2L transducer for recording ECG and a SS57L EDA (electrodermal activity) transducer. The software used to process and display these signals is very often AcqKnowledge (for research) or Biopac Student Lab (for education).

Although emotions cannot be captured or studied in a lab, the physiological changes that result from emotional experiences certainly can be.

For further reading about emotional affect, please see our blog “Circumplex Model of Affect and Motivational State.”

Other related BIOPAC resources:

BIOPAC offers a wide array of wired and wireless equipment that can be used in your research. To find more information on solutions for recording and analyzing signals such as ECG, heart rate, respiration, and more using any platforms mentioned in this blog post, you can visit the individual application pages on the BIOPAC website.

Photo by Noah Buscher on Unsplash


Fielding a Media Psychophysiology Team

Author: Ashley Churchill, M.A., BIOPAC Midwest Sales

Media psychophysiology research is being embraced by a variety of communication departments around the world. Media psychophysiology generally refers to the measurement of biological responses to messages in order to understand viewers’ cognitive and emotional processing of video, audio, or print messages. Media researchers often focus on measuring processes that occur as one interacts with media content over time and they look for insights into how and why certain media effects emerge (see Potter & Bolls, 2012 for more background).

Social science labs and communication researchers might feel daunted when starting up a lab if they are inexperienced in collecting physiology data. Here are three common strategies that will support the development of a media lab team and contribute to its success.

Ensure the research team has access to and is comfortable seeking out assistance from a variety of resources. Psychophysiology is a fundamentally interdisciplinary science. Incorporating it into your research requires that you draw on both technical and conceptual knowledge from disciplines outside of social science. To complicate things, formal psychophysiology resources can be difficult to find within the typical social science department. Effectively using external resources like subject librarians, university IT, faculty across departments, and BIOPAC’s support team, can help overcome this challenge.

Explain the conceptual aspects of media psychophysiology to your research assistants, whether they are volunteering for the semester or plan to stick around for a few years. Providing RAs with a conceptual background regarding relationships between media, psychology, and physiology can mean the difference between success and failure as far as effectively identifying and resolving problems during an experiment. It takes more than simple knowledge of electrode placement to make someone effective in a data collection role. Guiding RAs in a way that reflects this supports stronger research and researcher retention.

Preserve the practical knowledge generated by your team, do not let it leave with them. Learning how to conduct media psychophysiology research takes time and experience. As different team members rotate in and out of the lab over time, continue to support lab practices that preserve their knowledge and understanding of this research approach. Whether this takes the form of storing informative documentation or encouraging them to lead aspects of new member onboarding, these practices are important to improving the effectiveness of your team over time.

To find more information regarding media psychophysiology, check out our recent webinar featuring media psychophysiology expert Dr. Paul Bolls. To learn about signals that are common in media psychophysiology research— like fEMG, ECG, and EDA—visit our library of on-demand life science webinars.


BIOPAC offers a wide array of wired and wireless equipment that can be used in your research. To find more information on solutions for recording and analyzing signals such as ECG, heart rate, respiration, and more using any platforms mentioned in this blog post, you can visit the individual application pages on the BIOPAC website.

Photo by Vlad Hilitanu on Unsplash

VR—New Worlds to Explore

Use VR to Expand the Capabilities of Your Lab

The immersive technology of virtual reality (VR) literally offers whole new worlds to explore. Combining VR/Immersive Solutions with Physiology Data allows researchers to create virtual worlds that are impossible or prohibitively expensive in the real world. Additionally, researchers can synchronize VR events with physiological response data to record and analyze physiological, behavioral, and subjective response data. Multimodal stimulation can deliver visual (3D), auditory, olfactory, haptic, and/or electric stimulus to add an incredible degree of realism to the immersive world!

Interfacing a VR workstation with a data acquisition system can add a new dimension to your research by combining objective measures with a tightly controlled experimental protocol. Immersive environments can take the subject anywhere and allow you to unlock the boundaries of your physical lab space and budget.

  • Create rich 3D environments that are 100% personalized to match your protocol.
  • Send physiological data back to the VR world to make decisions based on the participant’s physiological responses

Participants can move around naturally within the virtual world while their physiological data is captured. Record any combination of signals: ECG, EDA, EEG, EOG, EMG, EGG, temperature, respiration, and pulse. Include eye tracking to track subjects’ gaze as they view the immersive environment during the experiment. Close synchronization between the stimuli and the physiological signals is achieved through digital markers.

Monitor data in real time and use detailed signal analysis for post-acquisition scoring of the data. Automated analysis routines can streamline the analysis process, eliminate subjectivity, and save time—see AcqKnowledge for some powerful options.

VR software provides you with an unlimited degree of flexibility to create a specific world and control people and items within the world. VR software is easy to use and adaptable, so researchers can make subtle changes to an experiment without having to redesign the entire protocol.

Immerse your subjects in a BIOPAC VR world and record physiological data as the virtual environment influences the subject. Applications are varied and include Psychology, Biomechanics & Kinesiology, Ergonomics, Marketing/Consumer Research, Healthcare, Computer Modeling/Simulation, Education, Training: hazard, medical, etc.,

Use a feedback loop for greater control and automation of the VR world. This allows the world to change in real time, based on the participant’s responses. Timing events are recorded for tight synchronization with physiological data for meaningful analysis.

See VR Resources here for more examples of how VR can expand the capabilities of your lab!

BIOPAC offers a wide array of wired and wireless equipment that can be used in your research. To find more information on solutions for recording and analyzing signals such as ECG, heart rate, respiration, and more using any platforms mentioned in this blog post, you can visit the individual application pages on the BIOPAC website.

Photo by stem.T4L on Unsplash

Meet Them Where They Are—Portable Wireless Solutions

Once relegated to tightly controlled lab environments where electrode-laden participants were observed at close quarters, researchers are now able to extend the lab into the everyday environment over nearly limitless distances. Top quality physiological data can be acquired from untethered subjects performing tasks ranging from sleeping comfortably in their own beds to engaging in high-impact sports. How and when did this deep dive into unfettered physiology become possible? We offer a brief examination of the solutions currently offered as the 2020s emerge.

BioNomadix BioShirt

Lightweight, comfortable, and some might even say fashionable, the BioNomadix BioShirt uses a respiration sensor and fabric electrodes to wirelessly record respiration and ECG from ambulatory subjects performing unfettered tasks in short or long-term studies, in the lab, or in the real world. The shirt connects to a BioNomadix wireless Respiration & ECG Transmitter (BN-RSPEC) secured in a small pocket on the front of the BioShirt—no electrodes, gels, or wires need apply. Wireless data can be transmitted to a BioNomadix Smart Center, Logger or matched Receiver+MP160/MP150 System. BioShirts provide a high level of comfort and are ideal for long-term physiological monitoring. The ECG and respiratory signal are obtained by means of sensors made of yarns that are fully integrated into the shirt’s textile structure. Sensors are made of fibers directly woven during the production process, and connections between sensors are obtained using conductive fibers for a totally unobtrusive, highly comfortable sensorized garment. The base yarn is composed of anallergic and antibacterial materials to guarantee safe and prolonged use. Machine washable with mild detergent—do NOT use fabric softener.

Smart Center

The BioNomadix Smart Center is a small-form USB-powered data acquisition unit that can record data from up to three wireless BioNomadix transmitters at a time. The transmitters are automatically detected and paired using a guided setup wizard. Smart Center is compatible with 14 different BioNomadix Transmitter types encompassing all major body signals. AcqKnowledge data acquisition and data analysis software also supports monitoring transmitter battery levels, automatic configuration of derived signals and guided analysis based on the type of recorded signals. Adhesive Velcro disks are included for mounting on various surfaces. Smart Center offers a compact and sophisticated physiology platform that sets up in minutes. Simply plug the Smart Center into the computer, set up the transmitters and subject, then start recording high quality data with AcqKnowledge software.

BioNomadix Wireless Wearable Physiology Logger

Offering the industry’s only system that delivers a comprehensive, 24-hour data logging solution in an easy-to-use, easy-to-wear package, the BioNomadix Logger truly delivers “physiology anywhere.” The BioNomadix Logger is the perfect tool for applications that demand greater degrees of subject freedom and complex experimental design. BioNomadix Loggers wirelessly record physiological data as subjects freely and naturally live their lives.

BioHarness Telemetry and Logging Systems

BioHarness with AcqKnowledge software is a lightweight portable biological data logger and telemetry system that monitors, analyzes, and records a variety of physiological parameters including ECG, respiration, posture, and acceleration. BioHarness applications include physiology, psychology, psychophysiology, exercise physiology, ergonomics, human factors, and more. The BioHarness operates in Bluetooth transmitting mode for live viewing of data or data logging mode. In the data logging mode, BioHarness acquires and saves the data for later download to AcqKnowledge software using the included USB docking and charging cradle.

Eye Tracking Glasses ETV

The ETVision (ETV) wearable unit resembles a pair of eyeglasses that can be worn by itself or over the participant’s prescription eyeglasses. The glasses incorporate miniature “eye cameras” for viewing each eye and a “scene camera” that views what the participant is looking at. A built-in microphone is included, and an optional visor can be mounted to the front of the headgear. Recording video and audio data to an SD card for later data processing allows the participant to be completely untethered during data recording. This is useful while engaging in long term activities away from the lab such as walking, bicycling, or driving.

For more information about BIOPAC wireless solutions, we invite you to view the following resources:


BIOPAC offers a wide array of wired and wireless equipment that can be used in your research. To find more information on solutions for recording and analyzing signals such as ECG, heart rate, respiration and more using any platforms mentioned in this blog post, you can visit the individual application pages on the BIOPAC website.

Photo by Fabio Comparelli on Unsplash

error: Content is protected !!